
September 24, 2018 | Biomember
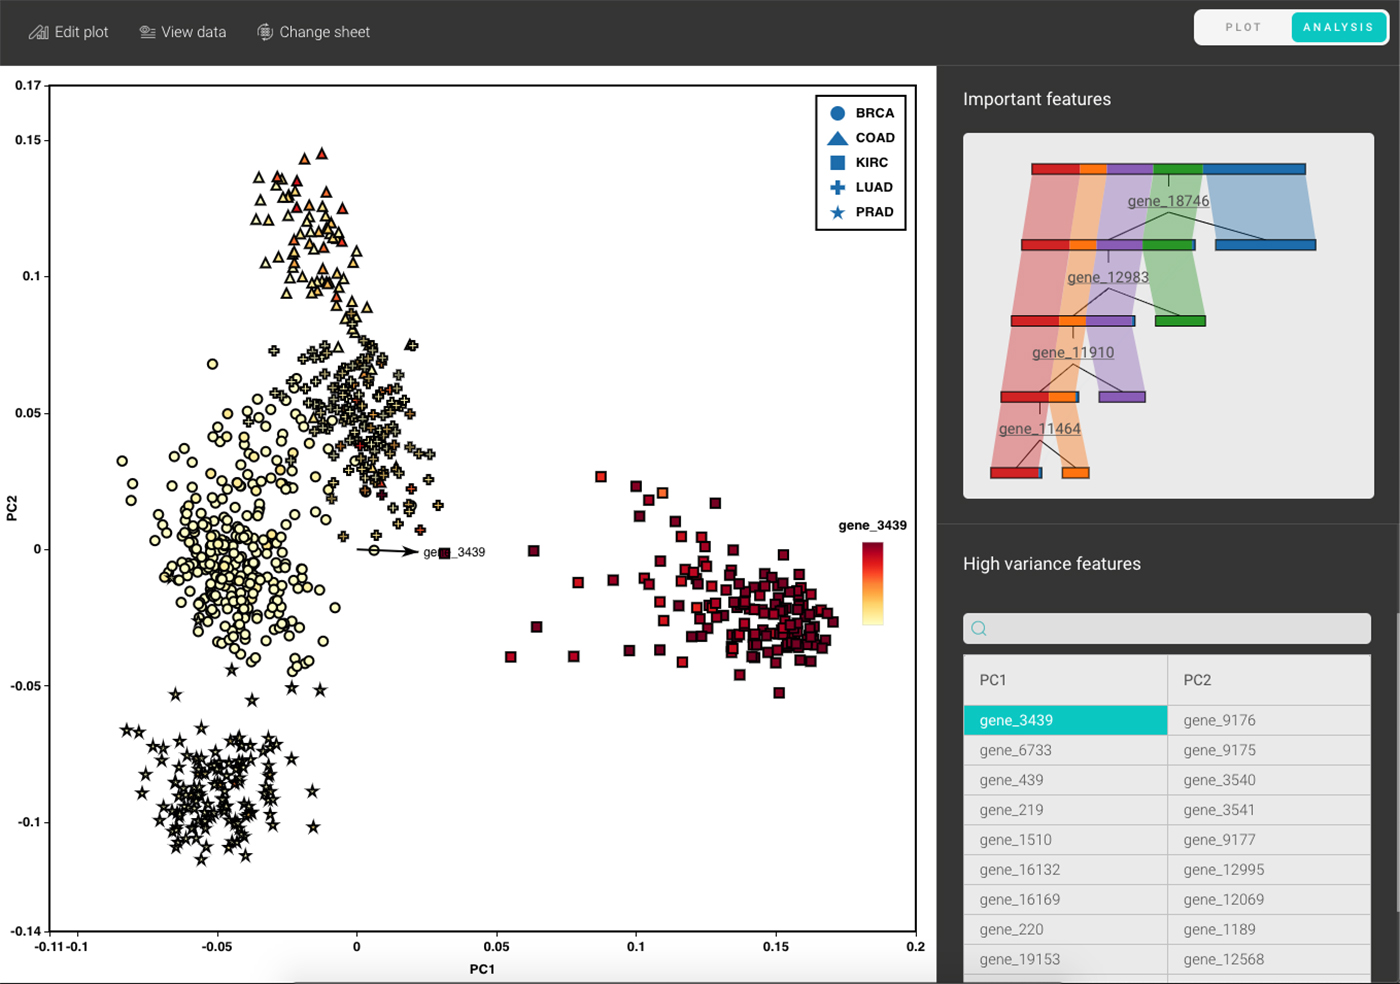
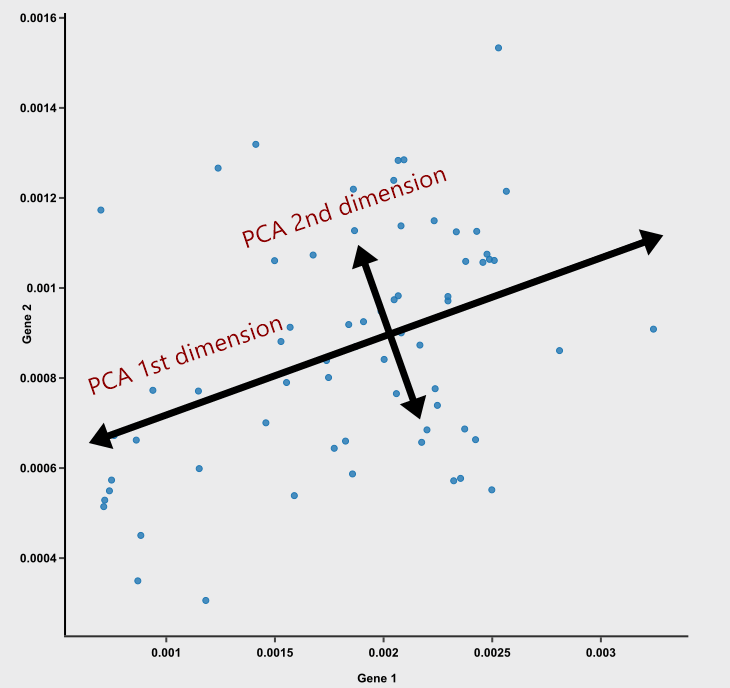
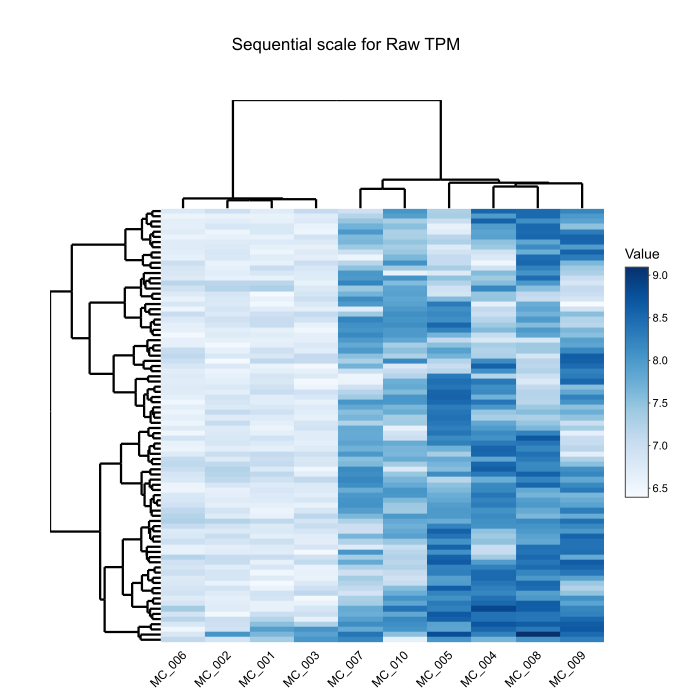
How to extract the biology behind this huge matrix of thousands of rows and columns?”
Large numbers of data points hold valuable bio-logical stories yet are tricky to graph and analyze. Imagine you had the data for 1000 features and observations, your mind would be full of questions, wondering how to treat it in the right way, what is the go-to visualization method for it, and how to identify the most important features.
5/23/2018 | Linh Ngo
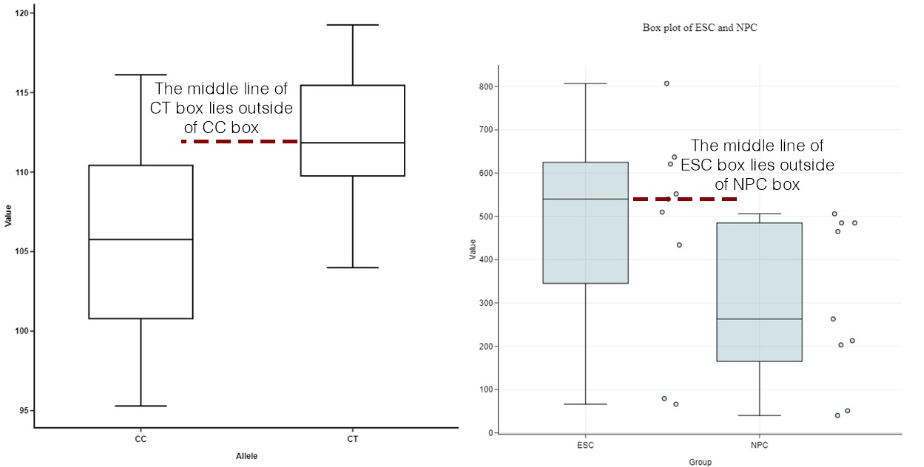
Box plots, a.k.a. box-and-whiskers plots, are an excellent way to visualize differences among groups. They manage to carry a lot of statistical details — medians, ranges, outliers — without looking intimidating. But box plots are not always intuitive to read. How do you compare two box plots?...
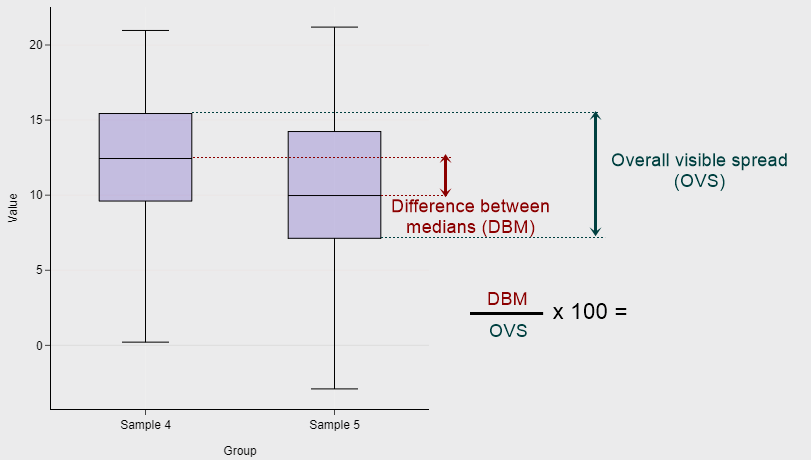
5/22/2018 | Linh Ngo
At first glance, it is easy to think a longer section on a box plot represent a higher count. That is not the case. Take a look at this box plot....
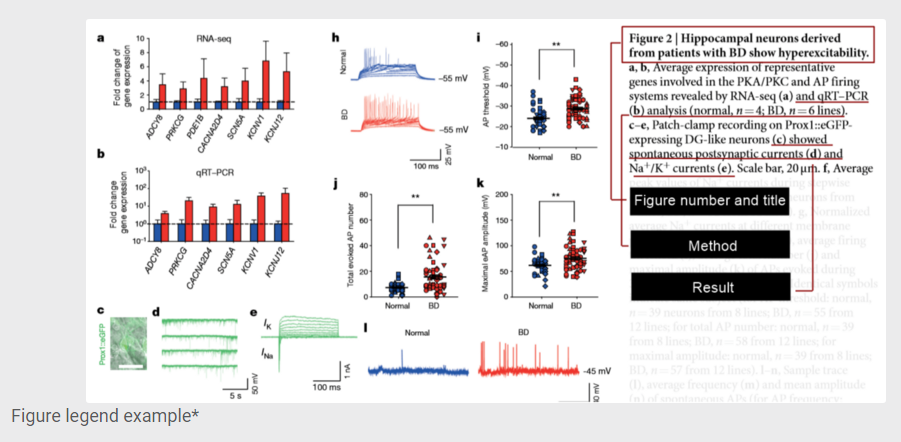
April 26.2018 | Linh Ngo
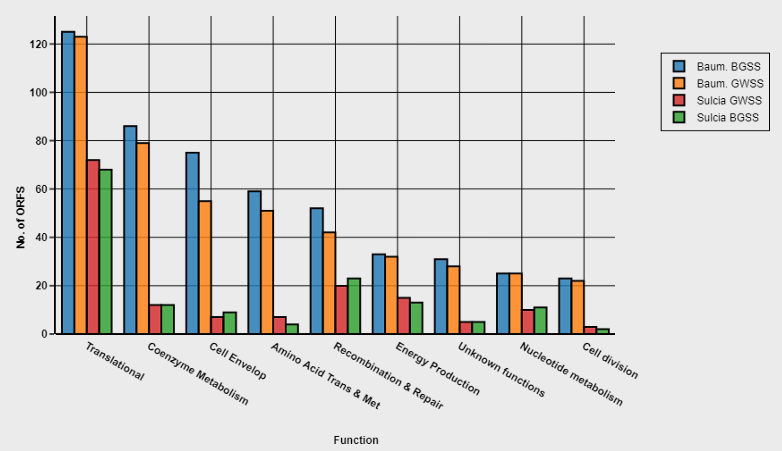
When it comes to presenting data, visuals are your friend, or so we all heard. Tables are better than large blocks of text and numbers. Graphs and charts are better than tables. Then it becomes irresistible to enliven your graphs and charts with colors, patterns, grid lines, labels, and the likes. The more visual they are, the better, right?
September 24, 2018 | Biomember
Heatmaps. We see them all over the scientific journals — the shading matrices that convey meaningful stories. Wanna interpret gene expressions? Draw a heatmap. Gotta examine the correlation among variables? Get it done with a heatmap....