Dimensionality reduction
algorithms
BioVinci automatically runs state-of-the-art methods and recommends the best one to visualize your high dimensional data.
See what's available:
|
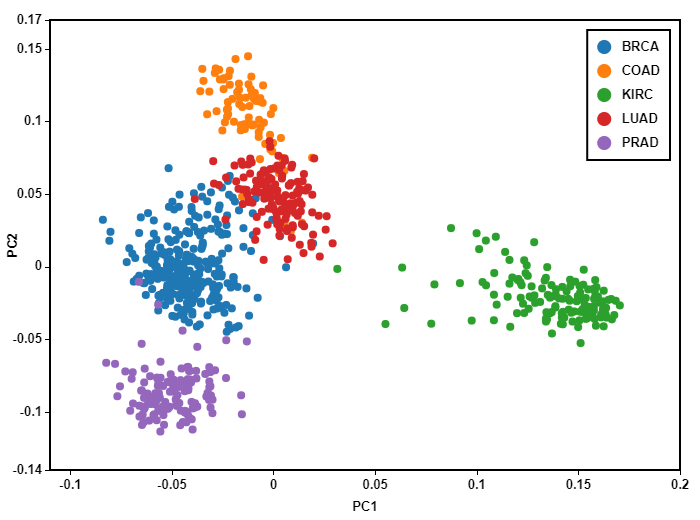
Principal component analysis (PCA) in 2D/3D |
|
|
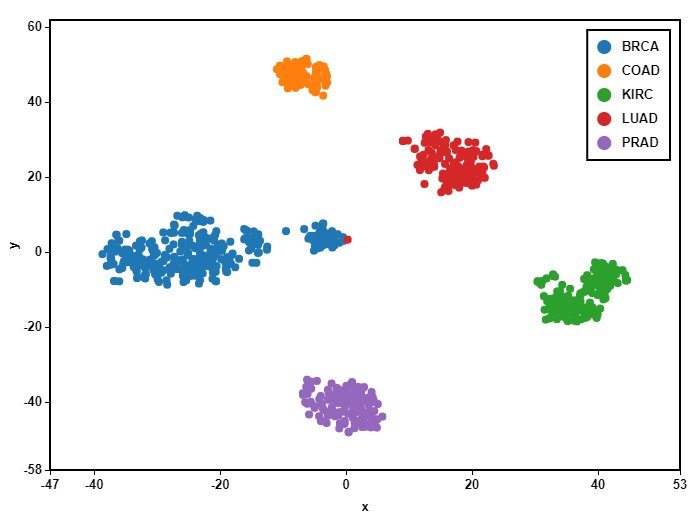
t-Distributed Stochastic Neighbor Embedding (t-SNE) |
|
|
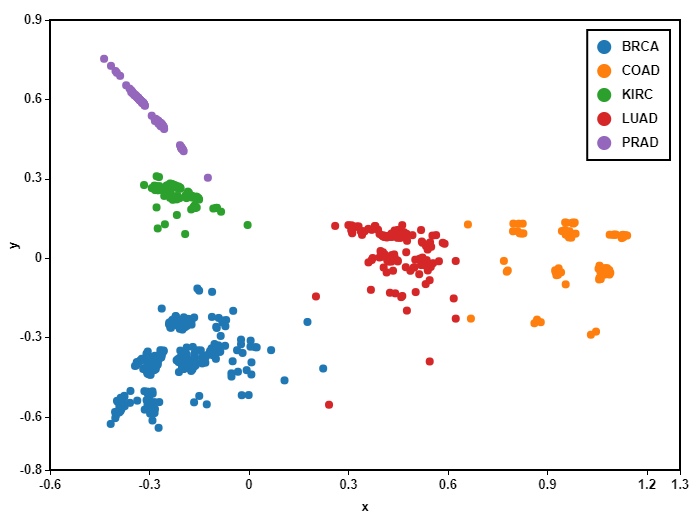
Uniform Manifold Approximation and Projection (UMAP) |
|
|
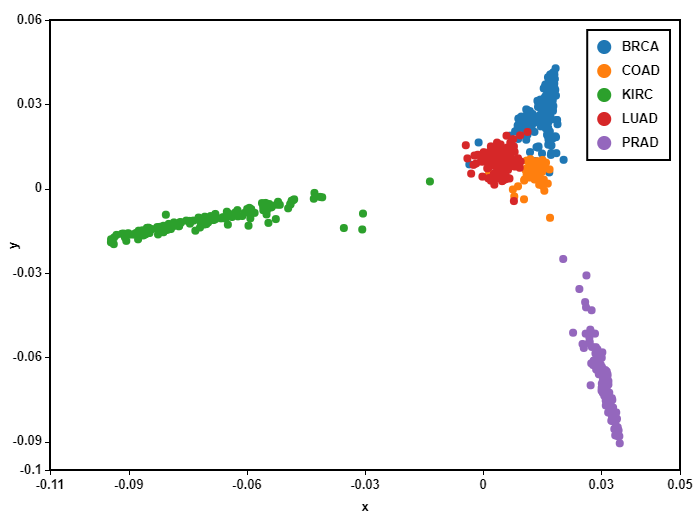
Isometric feature mapping (Isomap) |
|
|
Locally Linear Embedding (LLE) |

Feature selection
algorithm
- Find presentative features for a cluster
- Explore your data using the decision tree model
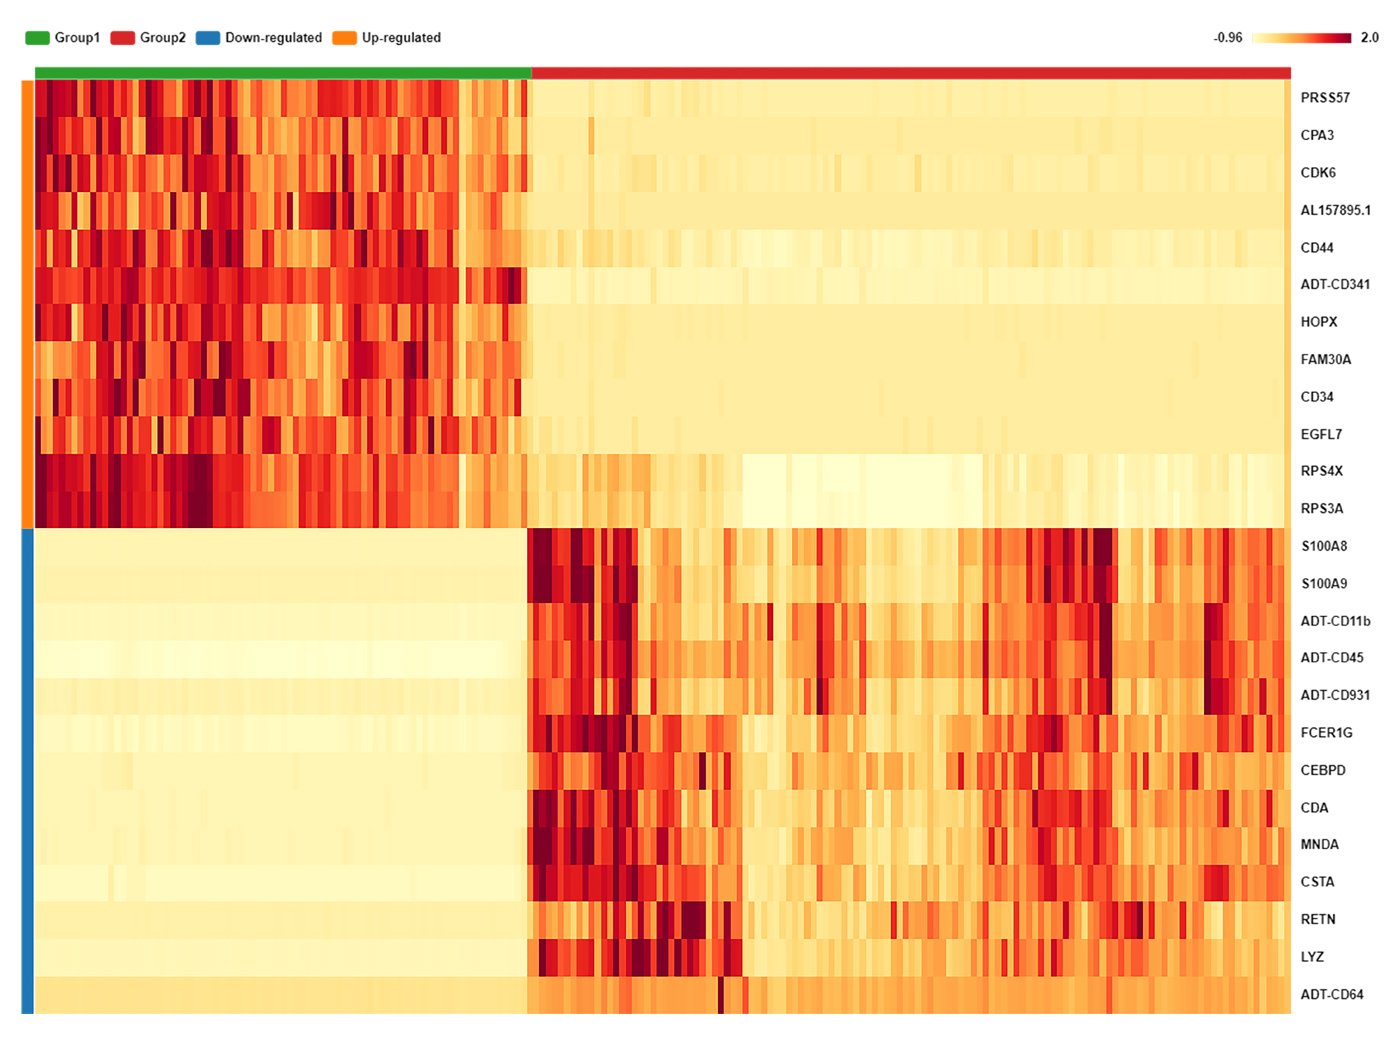
Interactive heatmap
- Quickly create heatmaps for datasets as large as
105 rows x 105 columns - Easily customize your heatmap
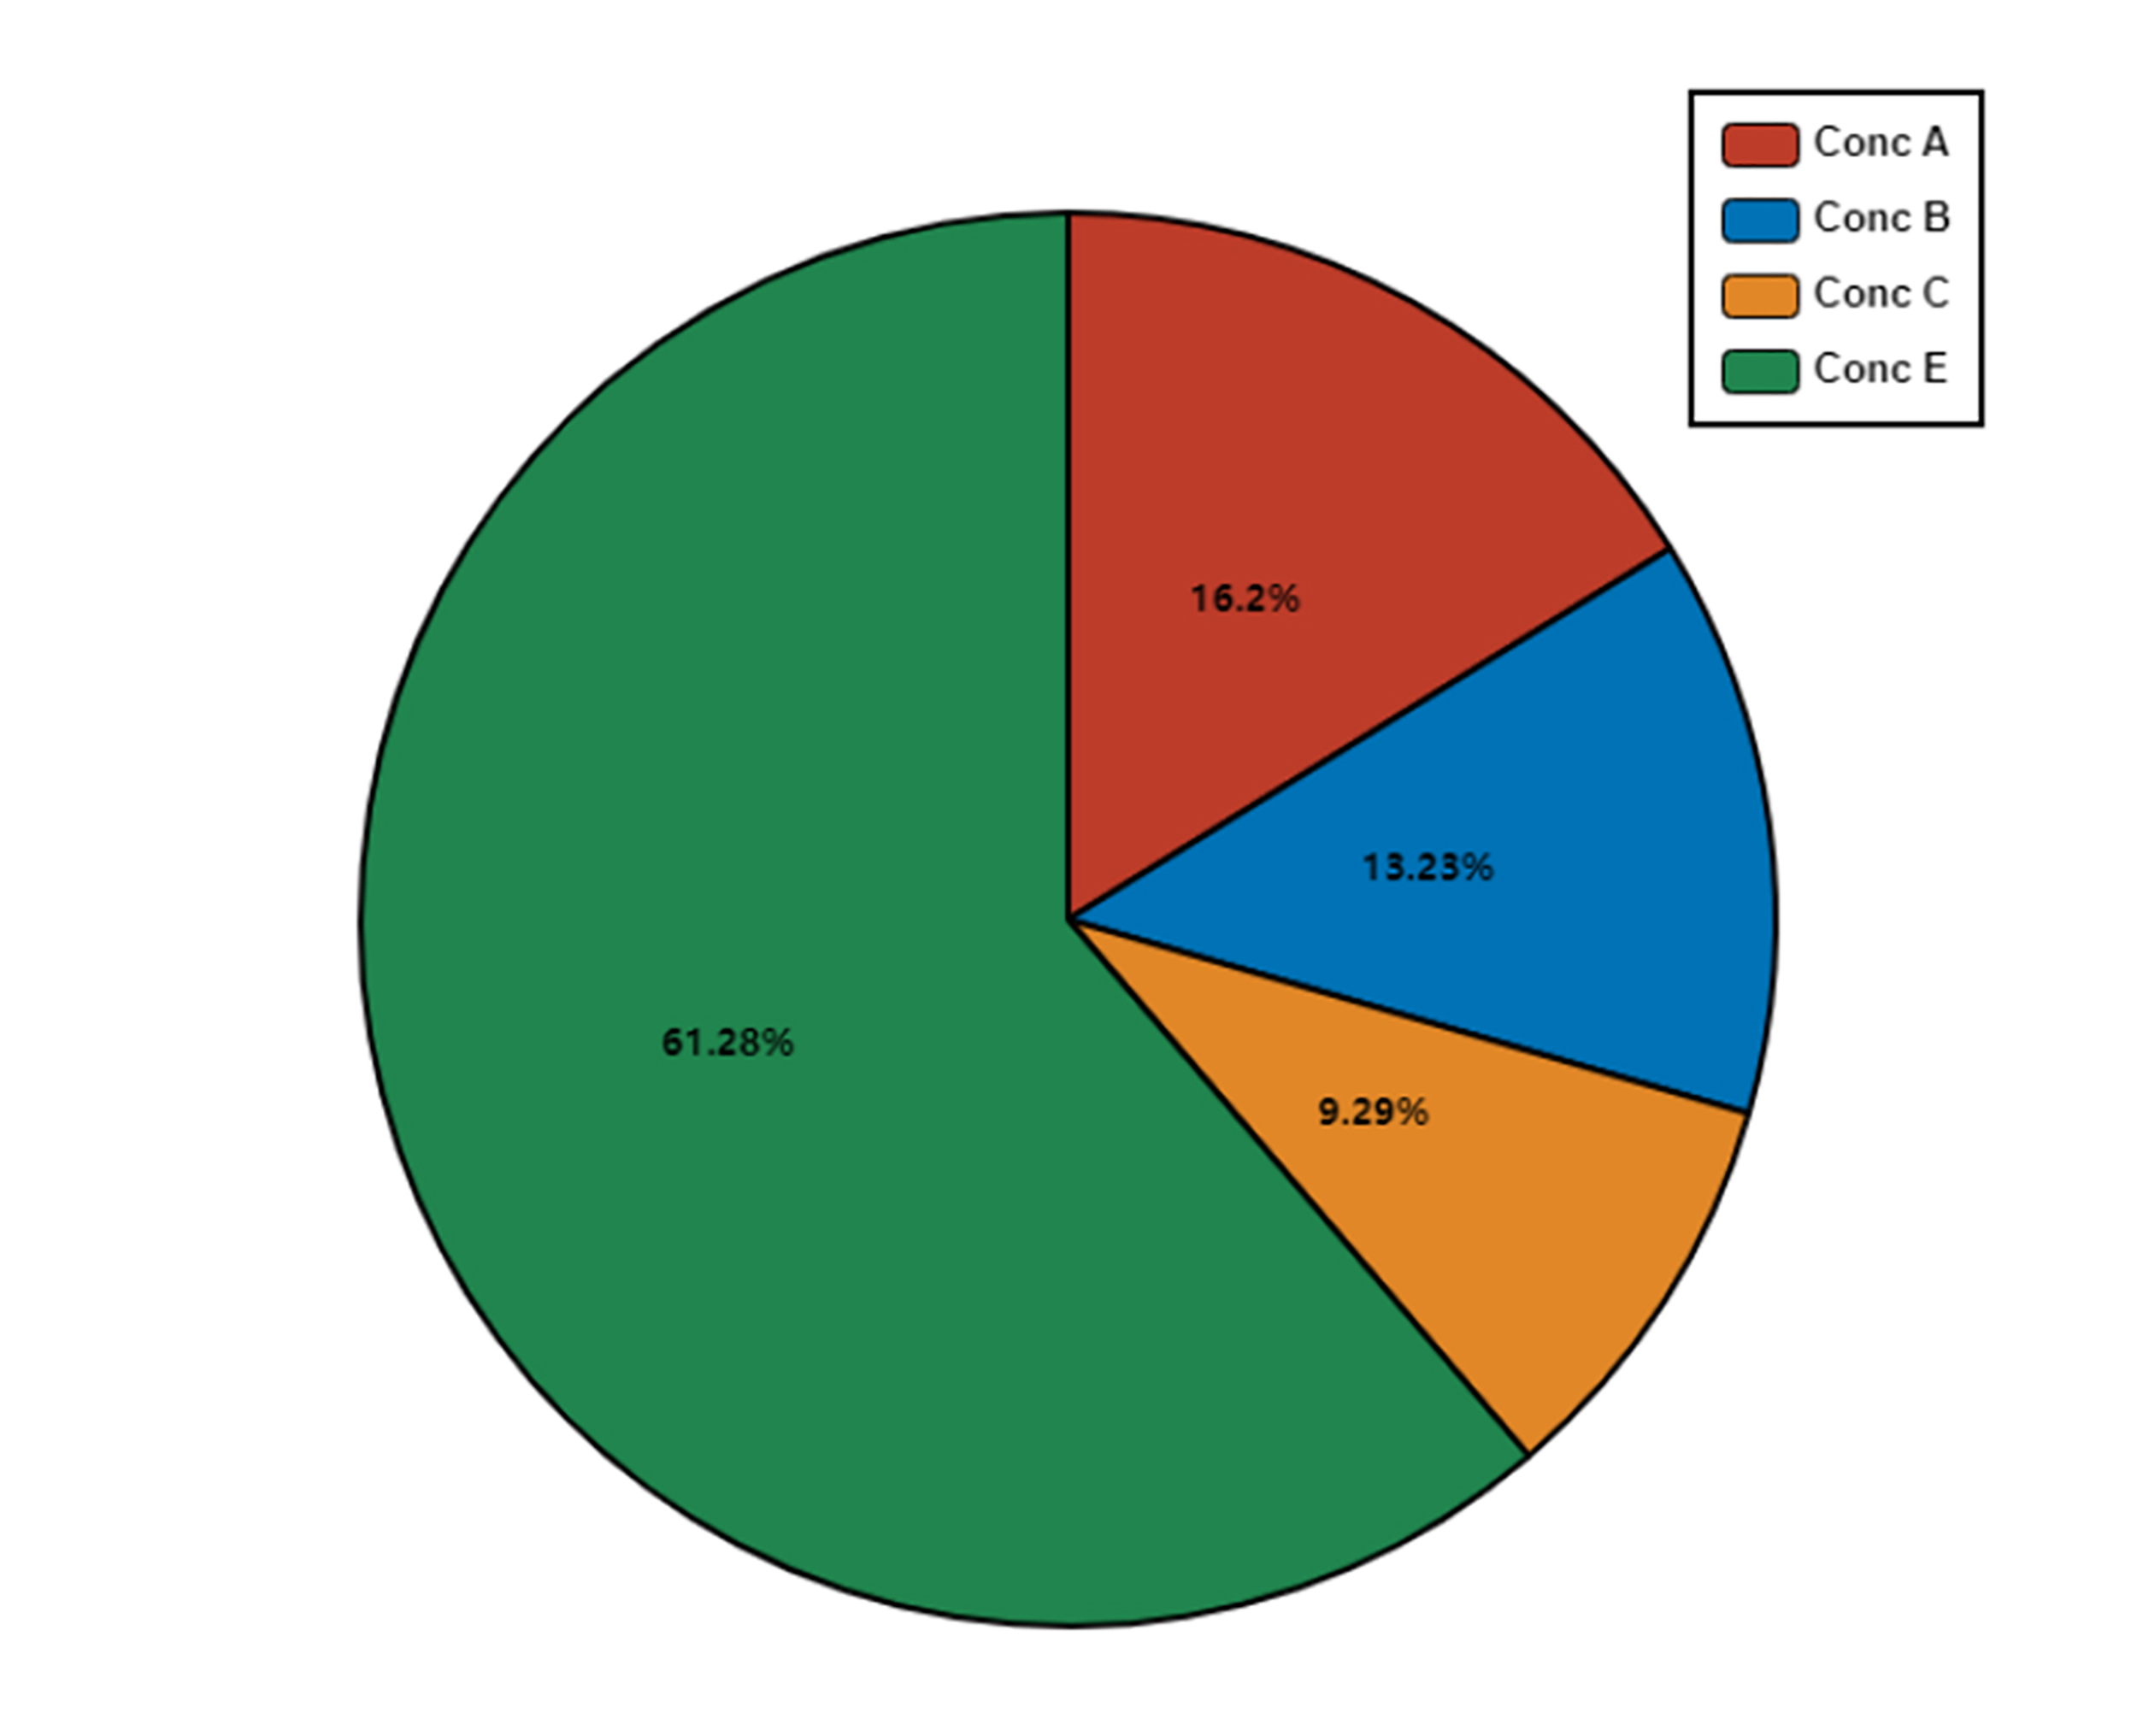
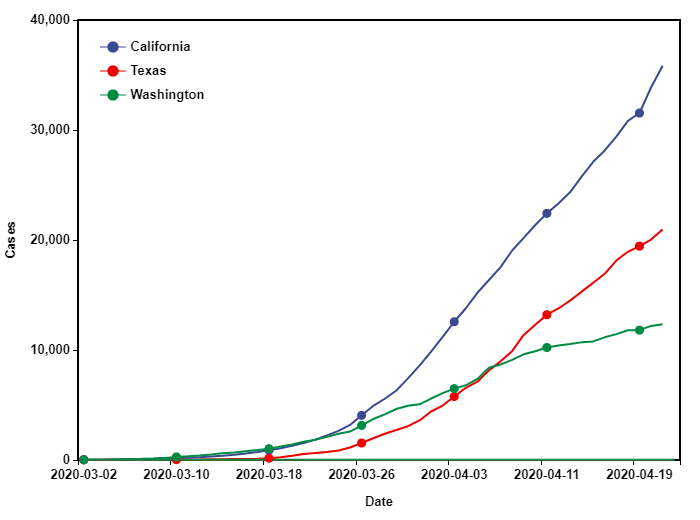
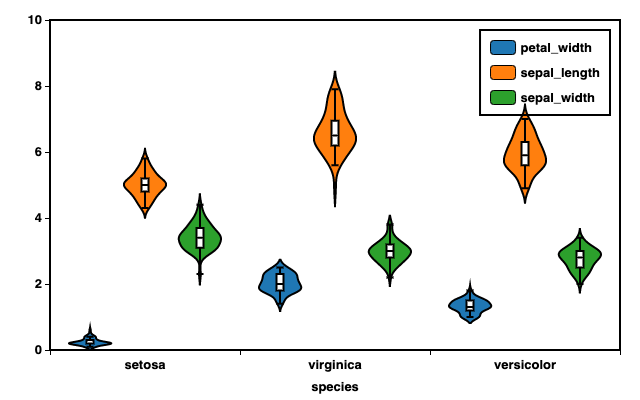
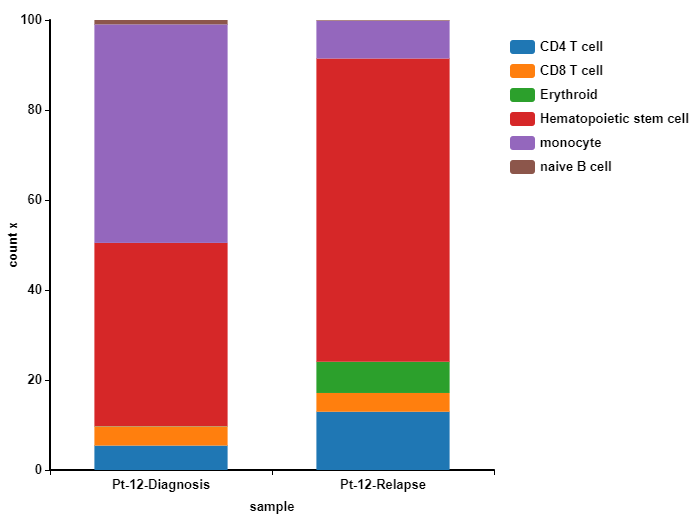
Elegant graphs
for life-science
- Drag and drop to visualize your data quickly
- Instantly apply publication-standard formats
- Flexibly edit graphs
- Export to PNG, SVG